
This Dr. Axe content is medically reviewed or fact checked to ensure factually accurate information.
With strict editorial sourcing guidelines, we only link to academic research institutions, reputable media sites and, when research is available, medically peer-reviewed studies. Note that the numbers in parentheses (1, 2, etc.) are clickable links to these studies.
The information in our articles is NOT intended to replace a one-on-one relationship with a qualified health care professional and is not intended as medical advice.
This article is based on scientific evidence, written by experts and fact checked by our trained editorial staff. Note that the numbers in parentheses (1, 2, etc.) are clickable links to medically peer-reviewed studies.
Our team includes licensed nutritionists and dietitians, certified health education specialists, as well as certified strength and conditioning specialists, personal trainers and corrective exercise specialists. Our team aims to be not only thorough with its research, but also objective and unbiased.
The information in our articles is NOT intended to replace a one-on-one relationship with a qualified health care professional and is not intended as medical advice.
BMI Chart for Women & Men: Is It Misleading?
December 13, 2023

Back in 1980, only around 10 percent to 14 percent of adults globally older than 20 years old were considered obese. Fast-forward to today, and the number of those struggling with obesity is around 30 percent to 40 percent.
Considering the World Health Organization (WHO) reports that worldwide prevalence of obesity has more than doubled since the 1980s, reducing the number of both children and adults who currently land in the “overweight” or “obese” ranges of the BMI chart is now a top priority.
The WHO currently classifies people’s weights based on body mass index (BMI) value. BMI measurement, which is formulated based on weight comparative to height, remains controversial, however — mostly due to limitations when it comes to understanding how someone’s unique body composition, gender, age and ethnicity all affect weight.
It’s clear based on evidence that body fat is not the only thing that causes someone to be heavier than others of the same height. Factors like muscle mass, bone density and even fluid retention also affect one’s weight.
Some believe that because BMI measurements overlook this, people who are athletic or who have high percentage of muscle mass tend to get categorized as being overweight despite having healthy lifestyles and little risk for obesity-related diseases.
On the other hand, the standardized BMI chart is still considered a useful public health tool for monitoring changes in one’s healthy weight, as well as a tool for health authorities to track progress in dealing with the obesity epidemic.
Research shows that the higher your BMI, the higher your risk for certain diseases likely is. These include common health conditions, some that are even deadly, such as heart disease (the No. 1 killer in many nations), high blood pressure, type 2 diabetes, digestive problems like acid reflux or gallstones, breathing problems, sleep apnea, and certain types of cancers.
So should you rely on the BMI chart to determine your health or turn toward other means and measurements instead? Below you’ll learn about the pros and cons of calculating and tracking your BMI over time, along with alternatives to focus on besides your weight — such as adding or maintaining more healthy, lean muscle mass.
What Is BMI?
Body mass index is a measure of someone’s body fat based on height and weight. It applies to both adult men and women and people of all ages. In other words, once you’re an adult, your BMI score shouldn’t change drastically as you get older.
Among physicians and certain health authorities, BMI measurements are used as one key assessment in determining if someone is at risk for obesity. Along with BMI, the other two primary tools for assessing one’s obesity risk are waist circumference measurements and measurements of things like cholesterol and blood sugar levels, which are significant risk factors for diseases and conditions associated with obesity.
The BMI Chart
As mentioned above, BMI or body mass index is calculated by a formula that takes into account someone’s weight compared to height. The National Heart, Lung and Blood Institute offers an easy-to-use BMI calculator to the public. (It’s applicable to both women and men.)
To figure out your BMI within seconds, you can enter your current weight and height using standard or metric measurements, at which point the calculations are all done for you. Once you know your BMI “score” from the BMI calculator, you can use it to see how you compare to other adults of your same height.
The BMI chart used by authorities like the National Institute of Health can be found here. The standardized BMI chart is split into four categories:
- Underweight = a BMI score less than 18.5 (note that some experts feel this number should be closer to 19, as a BMI of 18.5 is very rarely a healthy weight for most adults)
- Normal, healthy weight = BMI score between 18.5–24.9
- Overweight = BMI between 25–29.9
- Obesity = BMI of 30 or greater
For example, based on the BMI chart, an adult woman who is 65 inches tall (5 feet, 5 inches) should be between 114 pounds and 144 pounds to be considered “normal.” Weighing 150–174 pounds would make her overweight, and above 180 pounds would mean she’s obese. (Anything above this amount would be considered “extreme obesity.”)
For an adult man who is 72 inches tall (6 feet), his normal or healthy weight range is considered 140–177 pounds, overweight would be 184–213 pounds and obese would be over 220 pounds.
How was the BMI chart — and these four categories — created to begin with?
When the BMI chart was first developed, originally the goal was to help adults achieve what was known as their “ideal weight.” Starting in the 1940s, ideal weight ranges were determined by someone’s height just like they are today but also took into account one’s body frame (or body composition). Heavier ideal weight ranges were established for large-framed women compared to small- or medium-framed women.
Eventually these ideal height and weight tables were criticized for being methodologically flawed, such as not considering genetic or age differences, so they’ve since been abandoned by researchers in place of using the BMI chart instead. According to a report in Nutrition Today, since around the 1970s BMI replaced other means of predicting or measuring obesity “despite many criticisms.”
Although research suggests that BMI measurements provide greater recognition of someone having a weight problem compared to previous height and weight charting, BMI is still inconsistently used by many doctors or patients.
Is the BMI chart applicable to children in addition to adults?

According to the Archives of Disease in Childhood, “The BMI is the best available tool for monitoring progress in the campaign against obesity,” and this includes childhood obesity. In fact, the House of Commons Select Committee on Obesity even recommends that the body mass index of every school-age child should be measured each year, and the result should be sent home to the parents in order to inform them of trends regarding their children’s health status.
However, surveys in the U.S. have found that only between 11 percent to 29 percent of pediatricians or other physicians calculate children’s BMI measurements during routine visits.
Barriers that doctors have reported regarding the use of BMI with children include not wanting to stigmatize children by telling them they’re overweight at a vulnerable age, not having time to perform another test during checkups, not fully believing that BMI is a good predictor of being unhealthy or not having good enough advice to give the child’s parents regarding how an overweight child should lose weight.
Problems With the BMI Chart
While the BMI chart might be helpful for identifying weight gain in a high percentage of people, it’s not foolproof nor an accurate depiction of being overweight or obese for every person. Even the National Institute of Health (NIH) points out that “although BMI can be used for most men and women, it does have some limits.”
The reason that most doctor visits still involve taking your BMI score is because someone’s BMI is said to be a “good gauge” of your risk for diseases like diabetes, heart disease, high blood pressure, high triglycerides and others tied to obesity. These diseases or conditions tend to occur in people who have higher levels of body fat than normal, although there’s a lot of debate over whether or not excess body fat itself contributes to these health problems directly or accumulates due to poor lifestyle habits that also cause weight gain.
Some of the criticisms associated with the BMI chart include:
1. BMI May Overestimate Body Fat in Athletes or Those With Muscular Builds
Probably the biggest criticism of the BMI chart is that it doesn’t consider someone’s individual body composition, including the ratio of body fat to fat-free mass. This neglects measurements like bone mass, muscle mass or frame size.
BMI also doesn’t consider gender differences, such as where fat is stored, or take into account the fact that certain locations for body fat (like near the waist) are more harmful than others (like near the thighs).
Studies show there are also significant ethnic differences when it comes to body composition. For example, people of Asian or African descent may be genetically smaller-framed than others, such as those of Hispanic or Native American descent. Surveys have found that African-Americans and Hispanics report significantly higher BMIs relative to their similarly weighted Caucasian peers, and even when taking into account other demographics like income, education and physical activity, those of Asian descent have lower BMIs than most other ethnicities.
Additionally, certain instances can make someone lose weight in an unhealthy way, such as when crash dieting or engaging in too much physical exercise — which can potentially decrease healthy muscle mass and bone mass.
2. BMI May Underestimate Body Fat in Older Adults Who Have Lost Muscle Mass
Older adults naturally lose some muscle mass as they age, which can lead to either weight loss or weight gain depending on the person’s lifestyle. While reduced muscle mass might mean weight loss and therefore a lower BMI score, this isn’t necessarily healthy.
There are plenty of benefits of having more muscle, so weight loss shouldn’t always be the goal, especially for those who are otherwise healthy but simply getting older and weaker due to sarcopenia.
3. Being “Overweight” Hasn’t Necessarily Been Proven to Be “Unhealthy”
Another controversial topic in the field of obesity research is that some studies suggest that overweight adults (but not those considered very obese) may not necessarily be any less healthy or more likely to suffer from mortality within a given period than adults who are within the normal BMI range.
One major finding from a 2013 meta-anaylsis published in the Journal of the American Medical Association was that overweight people were at least as healthy as normal-weight people based on data from 97 studies. In fact, some evidence exists showing that overweight people have a slightly lower risk of death than normal-weight people.
While many authorities still warn about the dangers of weight gain, the findings were clear that adults with a BMI between 25–35 (those considered either overweight or “Grade 1 obese”) did not seem to have an increased risk for all-cause mortality.
In order to advise the public regarding how to handle this news, the NIH states, “People who are overweight, do not have a high waist measurement, and have fewer than two risk factors may need to prevent further weight gain rather than lose weight.”
Authorities encourage people who are overweight to talk to their doctors to see whether they are at an increased risk for health problems based on other measurements, including waist measurement and risk factors for heart disease.
Better Tools to Determine Ideal Weight
The bottom line is that, as you can see, your BMI measurement or weight alone doesn’t determine your health. A better approach is to focus on improving your body compensation, such as maintaining lean muscle mass as you age and reducing fat in dangerous areas, such as your waist.
And remember that regardless of your current weight, practicing healthier habits — such as getting more exercise and reducing processed foods in your diet — will benefit you in many ways.
1. Pay Attention to Visceral Fat/Your Weight Measurement
One “red flag” to look out for is accumulation of fat around your waist/midsection, as well as a sudden or big change in your weight (or BMI score). Weight gain may be an indication that a lifestyle change you’ve recently made, such as decreasing the amount of exercise you do or changing your diet, is having a negative impact on your weight.
Excess fat around your midsection can be a sign of dangerous visceral fat, which is a strong risk factor for many diseases. Visceral fat is technically “excess intra-abdominal adipose tissue accumulation” — in other words deep fat that’s stored further underneath the skin than “subcutaneous” belly fat and that may wrap around vital organs, including the liver, pancreas and kidneys.
A large volume of research agrees that if most of your fat is located around your waist (rather than at your hips, giving you a “pear shape”), you’re at a higher risk for heart disease and type 2 diabetes. It’s been found that risk goes up when women have a waist size greater than 35 inches or men have one greater than 40 inches.
To determine your own waist measurement, use a simple tape measure around your middle, just above your hipbones, taking your measurement as you exhale fully out.
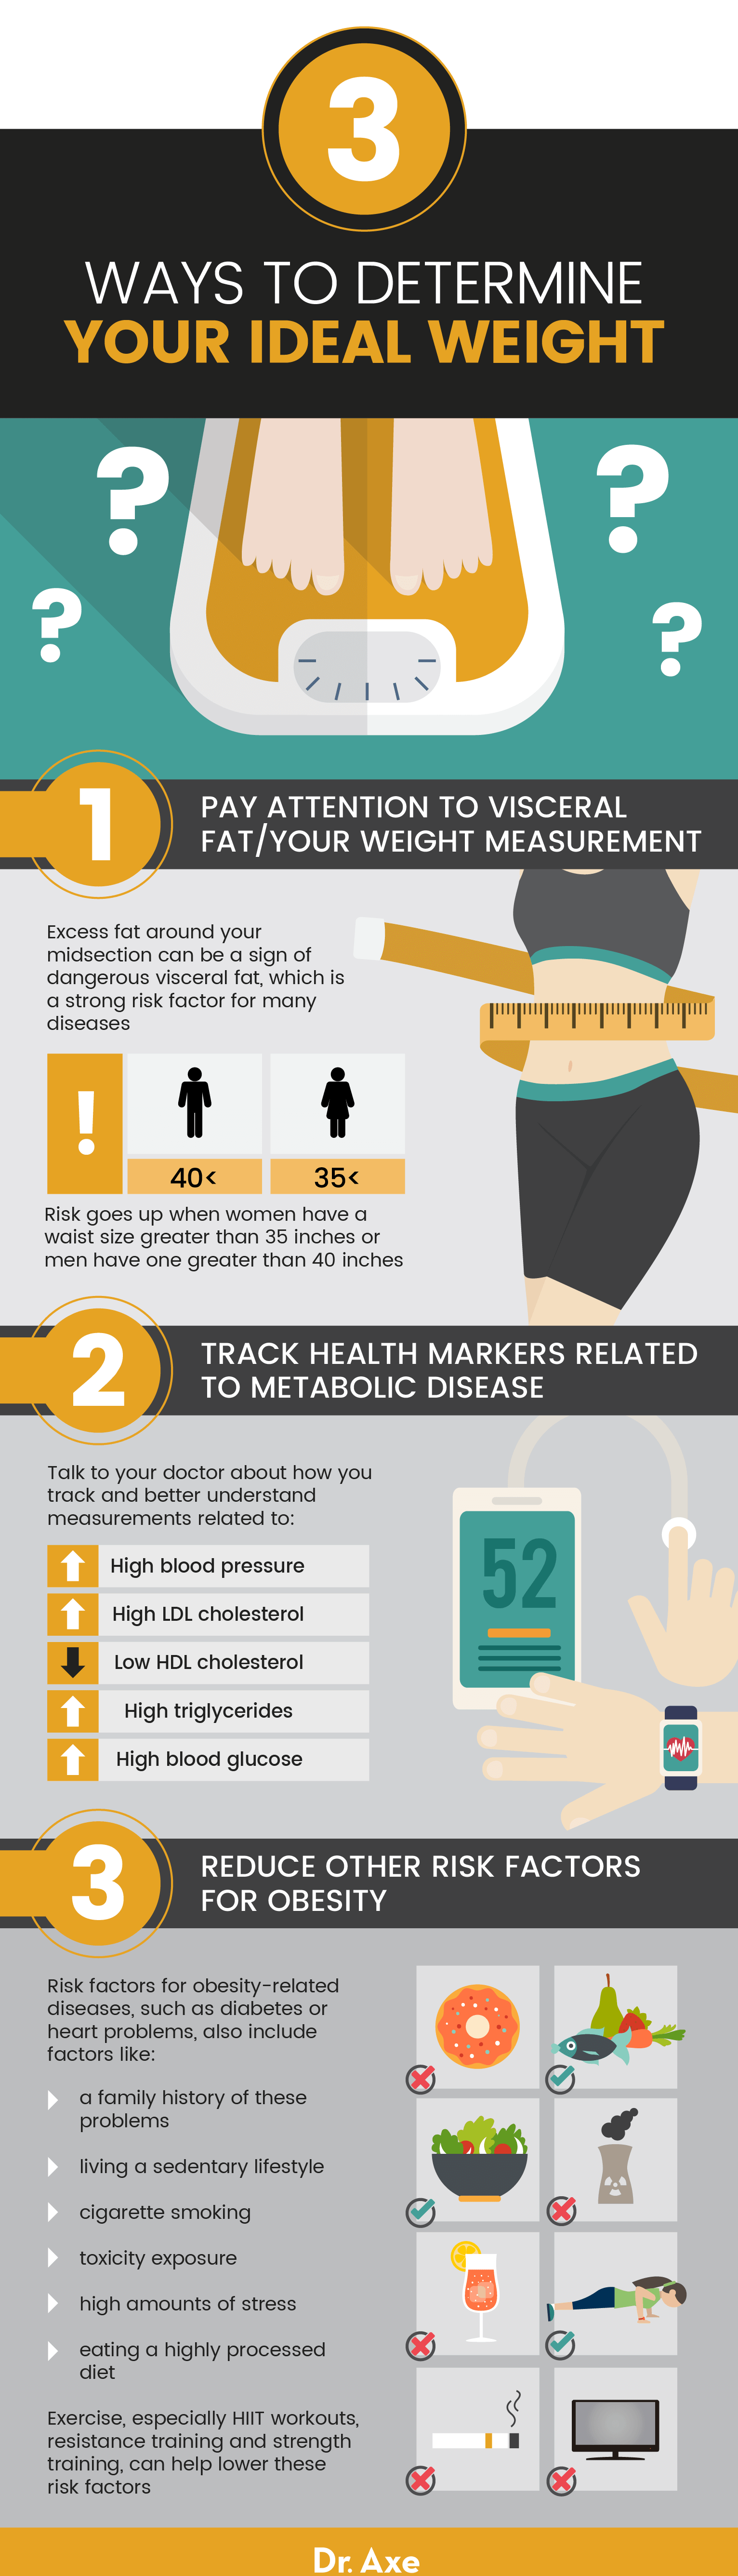
2. Track Health Markers Related to Metabolic Disease
Besides focusing on your weight, be sure that as you get older you continue to monitor and aim to improve measurements of the following conditions, which can put you at a greater risk for chronic disease when they fall outside of the “normal” or healthy range.
Talk to your trusted medical professional about how you track and better understand measurements related to:
- High blood pressure (hypertension)
- High LDL cholesterol (“bad” cholesterol)
- Low HDL cholesterol (“good” cholesterol)
- High triglycerides
- High blood glucose (sugar)
3. Reduce Other Risk Factors for Obesity
Additionally, keep in mind that risk factors for obesity-related diseases, such as diabetes or heart problems, also include factors like:
- having a family history of these problems
- living a sedentary lifestyle (too little physical activity)
- cigarette smoking
- toxicity exposure
- high amounts of stress
- eating a highly processed diet
One of the very best things you can do to better your health (both mind and body) is to regularly exercise, even as you get older.
While exercise alone likely won’t make you lose weight, there are numerous other reasons to keep it up. As people age, their muscle mass and muscle strength decline, but strength training exercise can reverse this and help keep you in a healthy weight range — not to mention help protect you from things like diabetes and depression.
Studies have found that high-intensity resistance training induces a faster visceral fat loss than most other types of activities. For a person to get the health benefits of exercise, the U.S. government recommends 150 minutes of moderate-intensity or 75 minutes of high-intensity aerobic exercise per week, along with two sessions of muscle-strengthening exercises. “Moderate intensity” exercise is defined as exercise that gets your heart rate up to between 64 percent and 76 percent of your maximum heart rate, which is based on things like your age and weight.
4. Use a Calorie and/or BMR Calculator
A study published in the journal Obesity found that changes in a person’s basal metabolic rate (BMR) — the number of calories burned at rest each day — affects how well people lose weight and even helps one learn how to keep the pounds from returning. Check out our BMR calculator.
For many, losing weight comes down to calories in and calories out. In other words, you simply need to consume fewer calories than you burn each day. Use our calorie calculator to determine how many calories you need at your current weight compared to the weight you want to be.
Final Thoughts
- BMI classifies people’s weight based on their height versus weight. According to the BMI chart used by most authorities, underweight = a BMI score less than 18.5; normal weight = BMI score between 18.5–24.9; overweight = BMI between 25–29.9; and obesity = BMI of 30 or greater.
- Limitations of relying on BMI measurements include failing to take into account body composition or muscle mass, ethnicity, genetics, older age, gender, or other risk factors, like waist measurement and cholesterol levels.
- Alternatives to using BMI scores to evaluate someone’s health include focusing on adopting healthier habits, reducing body fat near the waist, maintaining lean muscle mass, and improving measurements like blood sugar, blood pressure and triglycerides.